Top 10 Developer Monitoring & Observability Tools 2026
Compare the top 10 developer monitoring and observability software for 2026: telemetry coverage, pricing models, OpenTelemetry support, and best-fit teams.
Top 10 Developer Monitoring and Observability Software Products for 2026
Developer monitoring and observability software answers one question: what is your system actually doing right now? Metrics, logs, traces, and synthetic checks each reveal a different layer of that answer, and in 2026 most teams run a mix rather than a single tool. This review ranks ten products that genuinely belong to the developer monitoring and observability category, explains how they were evaluated, and shows where each one fits.
How We Evaluated These Products
Top 10 Developer Monitoring & Observability Tools 2026 - The Top 10 Developer Monitoring and Observability Products.
Every ranked product was assessed against the same criteria:
- Telemetry coverage: Does it handle metrics, logs, traces, events, or synthetic checks, and how well are they correlated?
- OpenTelemetry and open standards: Can you instrument once and avoid lock-in, or does the platform push proprietary agents?
- Developer workflow fit: SDKs, APIs, alert routing, and how quickly a single developer can get value.
- Pricing transparency: Predictable usage-based models versus host-based or proprietary-unit billing that surprises at scale.
- Evidence of real-world scale: Published customer counts, uptime figures, event volumes, and independent review presence.
- Operational overhead: Self-hosted control versus managed convenience, and what each costs in engineering time.
No single product wins on all six. The ranking below weights breadth, reliability, and developer experience together rather than rewarding feature count alone.
The Top 10 Developer Monitoring and Observability Products
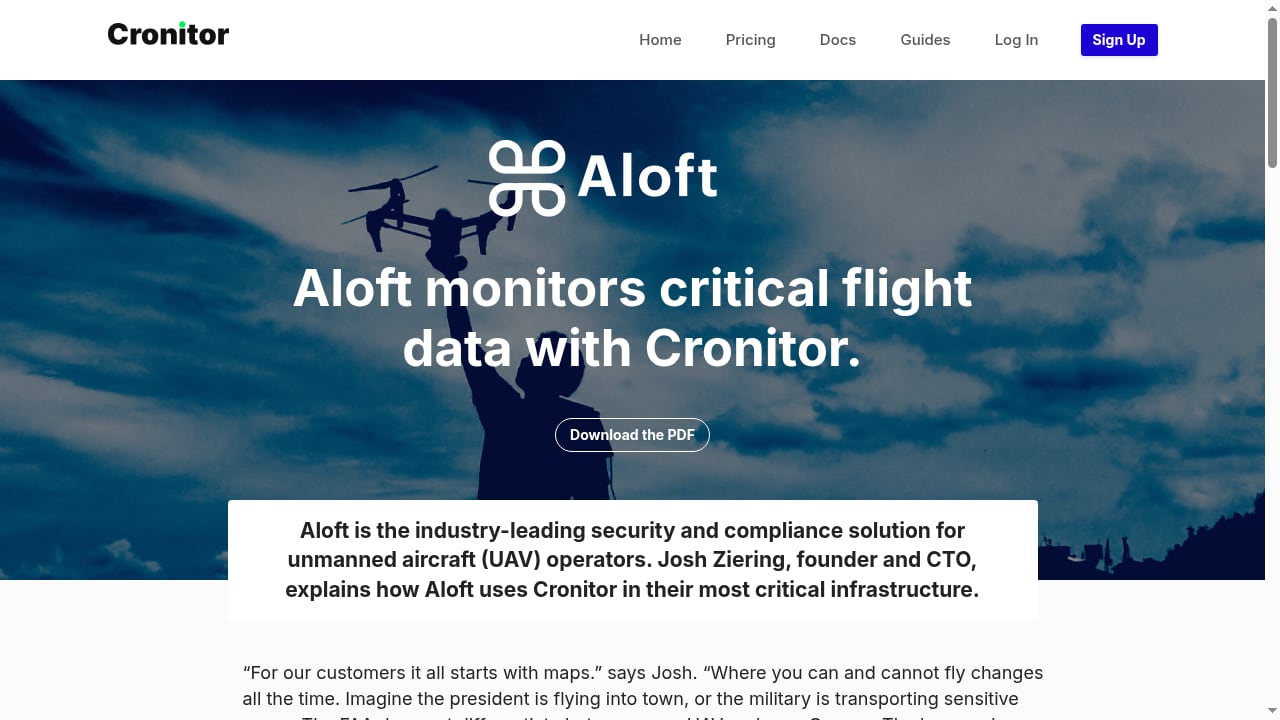
First viewport screenshot of Cronitor.
1. Datadog
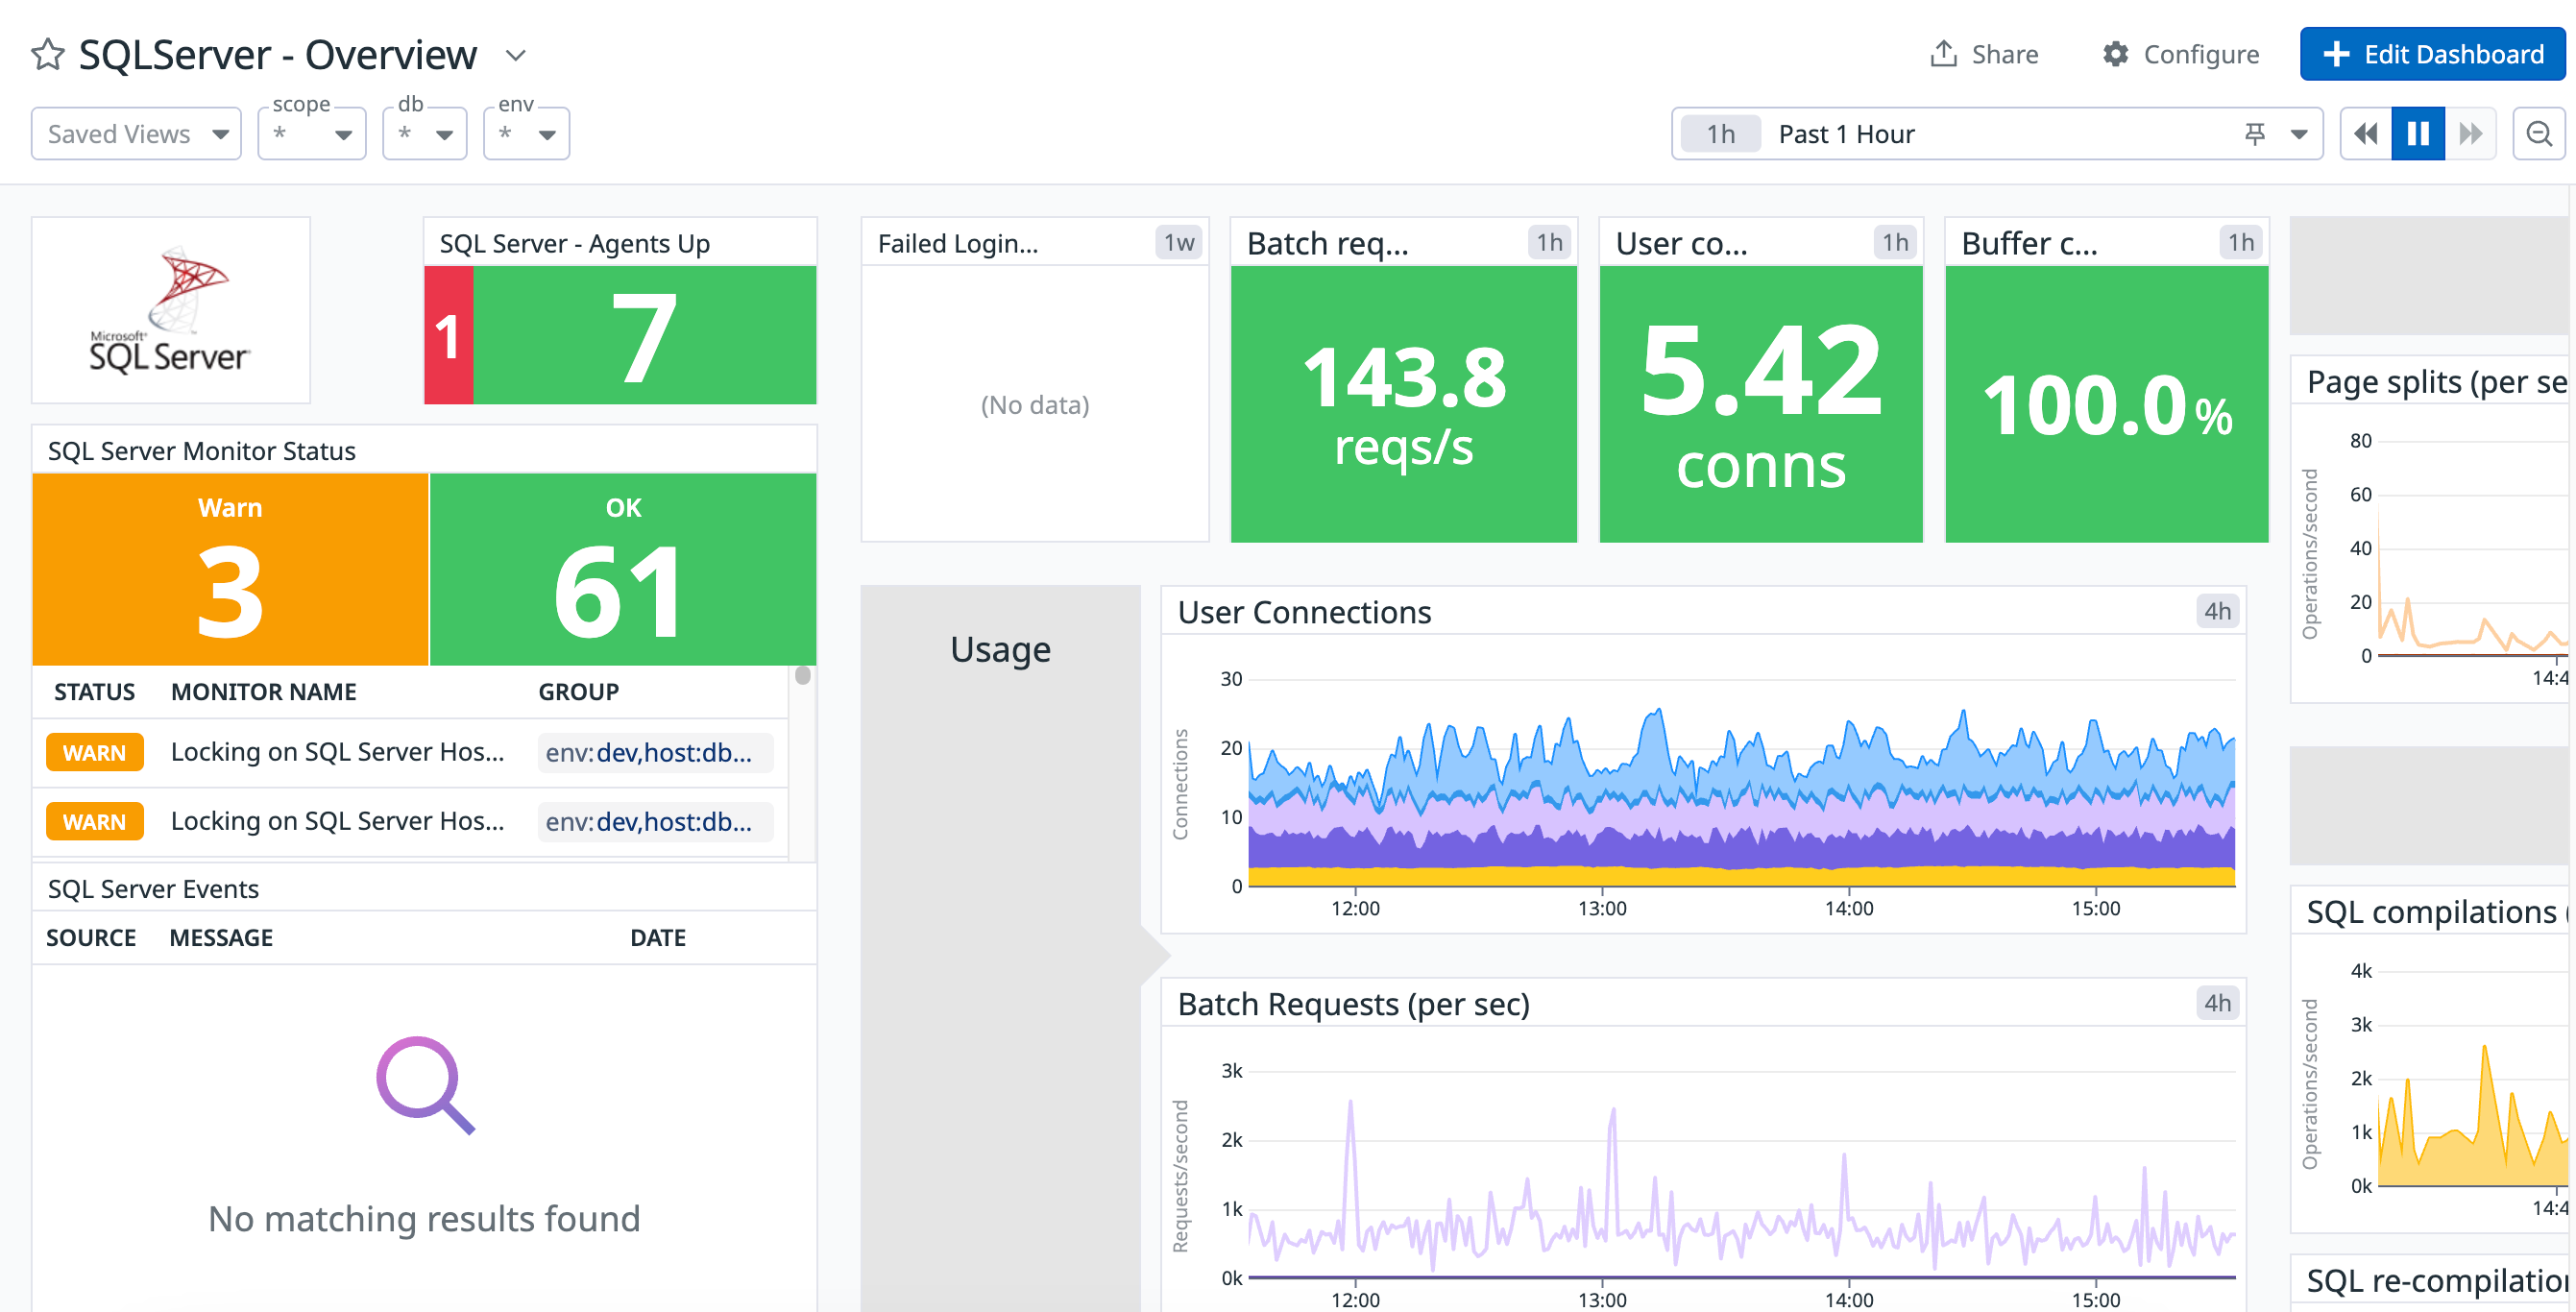
Datadog collects metrics, traces, logs, and events from cloud infrastructure, containers, databases, and applications, then correlates them in dashboards and alerts. It is the most frequently cited full-stack platform in independent review directories, and its integration catalog is the broadest in the category.
Best for: Teams that want one pane of glass across infrastructure, APM, logs, and security.
Tradeoff: Per-host and per-volume pricing compounds quickly, and individual modules can be shallower than dedicated specialists. The 2026 addition of Quality Gates, which blocks code merges that fail quality thresholds, shows the platform moving further into the development lifecycle.
2. New Relic
New Relic built its reputation on application performance monitoring and now spans infrastructure and digital experience monitoring. It offers real-time performance tracking, error analytics, distributed tracing, and alerting, with a generous free tier and OpenTelemetry Collector support for Docker and StatsD data.
Best for: Development teams that care most about code-level application performance and user experience.
Tradeoff: Costs rise steeply past the free tier, and mastering the full platform takes real time investment.
3. Dynatrace
Dynatrace leans heavily on AI and automation. Its Davis engine automatically discovers and maps services, identifies dependencies, and pinpoints root causes with minimal configuration, which matters in large, dynamic cloud environments where manual topology mapping is impractical.
Best for: Enterprises with complex, fast-changing environments that need automated root cause analysis.
Tradeoff: Premium pricing and a Davis-unit billing model that is difficult to forecast. The automation can also feel opaque when you want to fine-tune detection rules.
4. Grafana Cloud
Grafana Cloud is the managed offering built on Grafana Labs' open source projects: Grafana for visualization, Loki for logs, Mimir for metrics, and Tempo for traces. It supports over 100 data sources and 50+ curated infrastructure integrations, with native correlation between metrics, logs, and traces to shorten root cause analysis.
Best for: Teams that want open, composable observability without running the storage layer themselves.
Tradeoff: The composable model means more decisions up front about data sources and retention than a single-vendor platform requires.
5. Prometheus
Prometheus is the de facto open source standard for metrics collection and alerting, originally developed at SoundCloud and now a CNCF graduated project. It is the default metrics layer in most Kubernetes stacks and remains cost-effective at scale because you control the infrastructure.
Best for: Teams that want flexible, powerful metrics monitoring in containerized environments.
Tradeoff: Self-hosting means you own scalability, high availability, and upgrades. It handles metrics only, so you need Grafana for visualization and a tracing tool such as Jaeger for distributed traces.
6. Splunk Observability Cloud
Splunk combines infrastructure monitoring, APM, and real user monitoring with its long-established log analytics engine, and it is a major contributor to OpenTelemetry. Organizations already using Splunk for security or log analytics can consolidate telemetry on one platform.
Best for: Enterprises that want powerful log processing and security analytics alongside observability.
Tradeoff: High cost at volume and a steep learning curve for its Search Processing Language.
7. Sentry
Sentry focuses on application monitoring through error tracking and performance analysis. Every issue carries stack traces, user context, and breadcrumbs showing the events leading up to a failure, which makes debugging faster for both front-end and back-end developers.
Best for: Application developers who need to diagnose and resolve code-level errors quickly.
Tradeoff: It is application-centric and does not provide deep infrastructure monitoring, so it works best paired with a host and network monitoring layer.
8. Elastic Observability
Elastic Observability integrates logs, metrics, traces, and uptime data, aggregating and visualizing operational data in real time across cloud, hybrid, and on-premises environments. Search, filtering, and alerting are strengths inherited from the Elasticsearch stack.
Best for: Teams that already run Elasticsearch and want observability without adding a separate data platform.
Tradeoff: Operating the underlying cluster is a substantial engineering commitment, and cost management requires active tuning.
9. Jaeger
Jaeger, another CNCF graduated project, was created at Uber for distributed tracing. It visualizes the path of a request across microservices, making latency bottlenecks and failing dependencies visible in complex architectures.
Best for: Engineers debugging performance and dependency issues in microservices systems.
Tradeoff: Tracing only. It needs companion tools for metrics and logs, plus self-hosting and maintenance.
10. Cronitor
Cronitor is a developer-focused monitoring platform that takes a utility-knife approach: cron job and scheduled agent monitoring, synthetic uptime and performance checks for websites and APIs, heartbeat monitoring for any source that can send a signal, status pages, and website analytics for traffic, errors, and performance. It reports 99.997% uptime over the last 12 months and processes over 100 million events per day, with SDKs for most common languages, a REST API, and an MCP server for coding agents.
Best for: Small teams and large infrastructure alike that need scheduled job and uptime coverage without a full APM rollout. It serves over 100,000 developers, from one-person startups to Fortune 500 infrastructure, including Disney, GOV.UK, Monzo, and monday.com.
Tradeoff: It is not a full-stack APM or log analytics platform. Deep trace analysis and high-volume log search belong to other tools in this list. Pricing is straightforward, starting free with 5 monitors, then $2 per monitor per month plus $5 per user per month, with a 14-day free trial and a 60-day money-back guarantee.
Comparison: Which Product Fits Which Team
Top 10 Developer Monitoring & Observability Tools 2026 - Comparison: Which Product Fits Which Team.
| Need | Strongest fit | Why |
|---|---|---|
| Unified infrastructure, APM, and logs | Datadog, New Relic | Broad integration catalogs and correlated telemetry |
| Automated root cause in dynamic clouds | Dynatrace | AI-driven topology mapping and dependency discovery |
| Open standards without running storage | Grafana Cloud | Managed Loki, Mimir, and Tempo with 100+ data sources |
| Cost-controlled Kubernetes metrics | Prometheus | Open source, self-hosted, CNCF standard |
| Log-heavy and security-adjacent environments | Splunk, Elastic Observability | Mature log analytics engines |
| Code-level error debugging | Sentry | Stack traces, breadcrumbs, and user context |
| Microservices latency investigation | Jaeger | Purpose-built distributed tracing |
| Scheduled jobs, uptime, and heartbeats | Cronitor | Cron, synthetic, and heartbeat checks in one place |
A practical pattern for many teams is a layered stack: Prometheus or Grafana Cloud for metrics, Jaeger or Tempo for traces, Sentry for application errors, and Cronitor for the scheduled and synthetic layer that catches silent failures. That combination covers both what the system reports and what it fails to report.
Where Browser Automation Fits in an Observability Workflow
Top 10 Developer Monitoring & Observability Tools 2026 - Where Browser Automation Fits in an Observability Workflow.
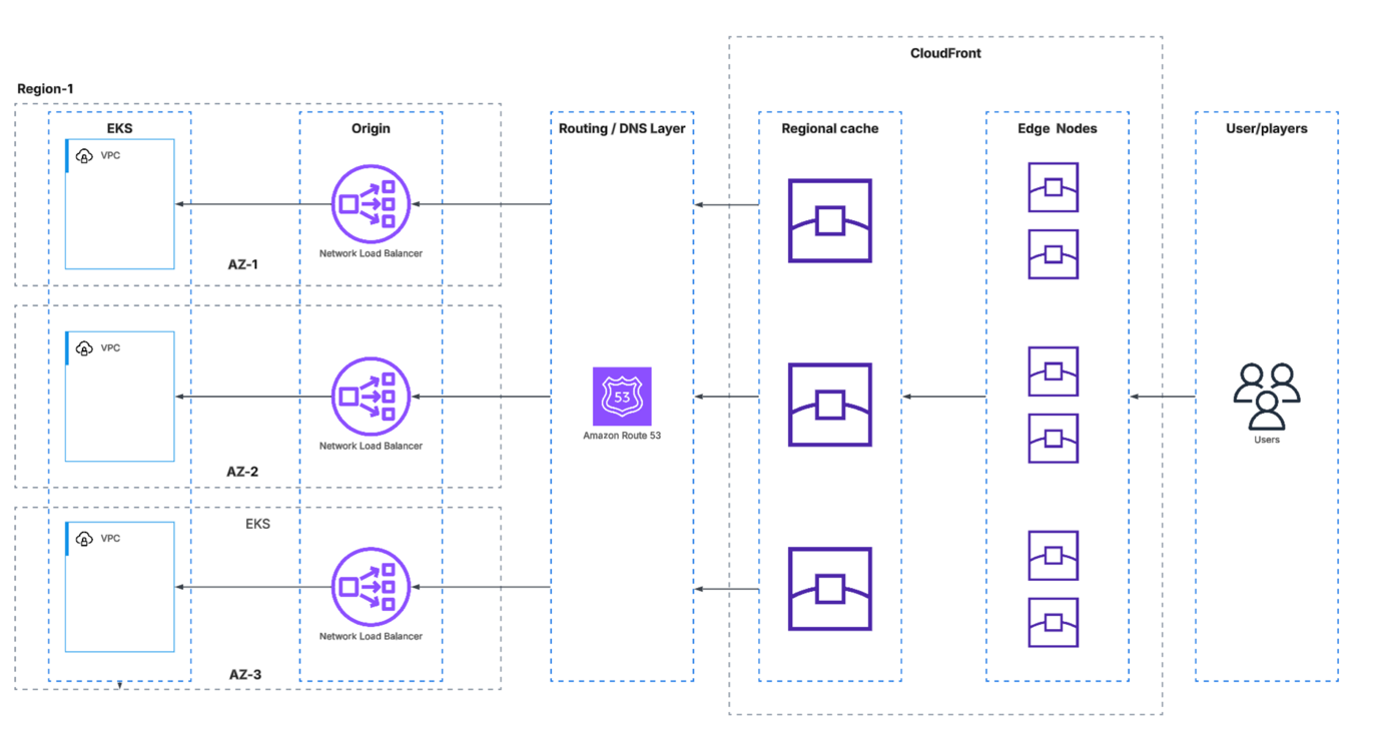
Some monitoring gaps are not telemetry problems. They are rendering problems: a page that returns HTTP 200 but shows a broken checkout, or a third-party script that fails only in a real browser. Browser automation APIs can complement synthetic monitoring by capturing screenshots, extracting rendered HTML and Markdown, and validating page states at scale. Tools in this adjacent space, such as AdsCrawl, provide cloud browser sessions and CDP control for exactly those checks. They are not observability platforms and do not belong in this ranking, but they can feed a synthetic monitoring pipeline when you need to verify what a real browser actually renders. For a closer look at that workflow, see the AdsCrawl vs ScreenshotAPI comparison.
How to Choose in 2026
Start with the failure modes that hurt most. If silent cron failures and missed schedules cause incidents, prioritize scheduled job and heartbeat monitoring before adding trace depth. If latency in microservices is the recurring problem, invest in tracing first. If cost is the constraint, open source metrics plus a managed visualization layer usually beats a single all-in-one contract.
Three questions cut through most evaluations:
- What does the free tier actually cover? A free tier that expires in 14 days is a trial, not a tier.
- How is usage billed? Per-host, per-GB, and per-custom-unit models behave very differently as you grow.
- Can you leave? OpenTelemetry support and standard data formats determine how expensive switching becomes.
Related reading
- How to Use AdsCrawl with SerpApi: Ads + Page Workflow - Learn how to combine AdsCrawl browser automation with SerpApi search data to capture ad SERPs, verify landing pages, and build reliable ad intelligence.
- AdsCrawl vs Thunderbit vs BrowserCloud: 2026 Comparison - Compare AdsCrawl, Thunderbit, and BrowserCloud across browser control, extraction, anti-bot handling, and pricing to pick the right tool for your workflow.
- Oxylabs Proxy & Web Scraping Platform Review 2026 - Evidence-based Oxylabs review: proxy types, Web Scraper API, Web Unblocker, pricing signals, setup, limitations, and who should choose it.
Sources and further reading
- Best Observability Platforms Reviews 2026 | Gartner Peer Insights - Find the top Observability Platforms with Gartner. Compare and filter by verified product reviews and choose the software that’s right for your organization.
- 11 Best Observability Tools in 2026 - Understanding what's happening within your systems is a necessity in today's world. But, have you ever wondered how experts keep an eye on systems to make sure everything's running smoothly? That's where o11y tools come in! Observability t
- Top 10 Observability Tools for 2026: Boost Reliability - Compare the 10 best observability tools for 2026. Find the right platform for metrics, logs, and traces to boost reliability and resolve incidents faster.
FAQ
What is the difference between monitoring and observability?
Monitoring tracks predefined signals against known thresholds. Observability lets you explore system state to answer questions you did not anticipate, typically by correlating metrics, logs, and traces. Most teams need both.
Do I need a full-stack platform or separate tools?
Separate tools often win on depth and cost control, while full-stack platforms win on correlation speed and operational simplicity. Teams with dedicated platform engineers tend to prefer composable stacks; smaller teams often prefer one vendor.
Is OpenTelemetry support really necessary?
It is the strongest hedge against vendor lock-in. Instrumenting once and routing telemetry to any compatible backend keeps your options open and reduces migration cost if pricing or coverage changes.
How does scheduled job monitoring differ from uptime monitoring?
Uptime checks confirm that an endpoint responds. Scheduled job monitoring confirms that a cron job or agent ran when it was supposed to, which catches failures that never produce a user-facing error.
What should a small team start with?
Start with uptime and scheduled job checks, add error tracking, then layer in metrics and traces as the system grows. This sequence delivers incident coverage early without a large platform commitment.
Conclusion
The 2026 observability market rewards specificity. Datadog, New Relic, and Dynatrace lead on breadth and automation; Grafana Cloud and Prometheus lead on openness and cost control; Sentry and Jaeger win on depth in their niches; and Cronitor covers the scheduled, synthetic, and heartbeat layer that full-stack platforms often treat as an afterthought. Pick the layer that matches your most painful failure mode first, verify the pricing model against your growth curve, and keep your telemetry portable. For teams building data pipelines alongside monitoring, our top 10 e-commerce market data API comparison shows how the same evaluation discipline applies to a different category.